Growth Plan
TrustHQ provides various features that allow you to gain valuable insights and better understand your review collection. Apart from accessing all your reviews, you can also visualize and analyze the reviews within the last 30 days, or sort them based on categories like shipping reviews, which can provide even more useful information.
 \
\
Under your Manage & Engage > Select a Subset of Reviews > Click Visualize Review Data.
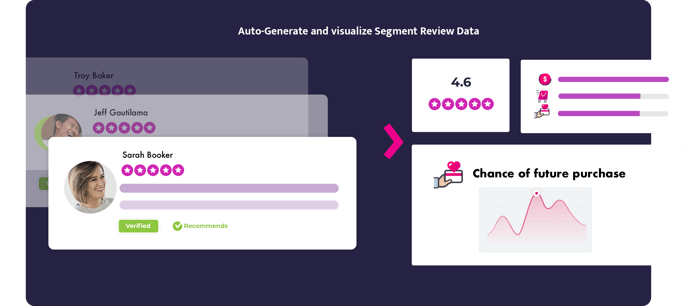
What can I see?
When you start looking at the visualization, you'll see a lot of information. Let's take a closer look and see what we can learn from it.
- Average rating amongst selected reviews
- distribution breakdown of your subset of reviews from 1-5
- The general sentiment over the selected timeframe
- Your review collection rate trend
- Your rating history trend on average over the time period
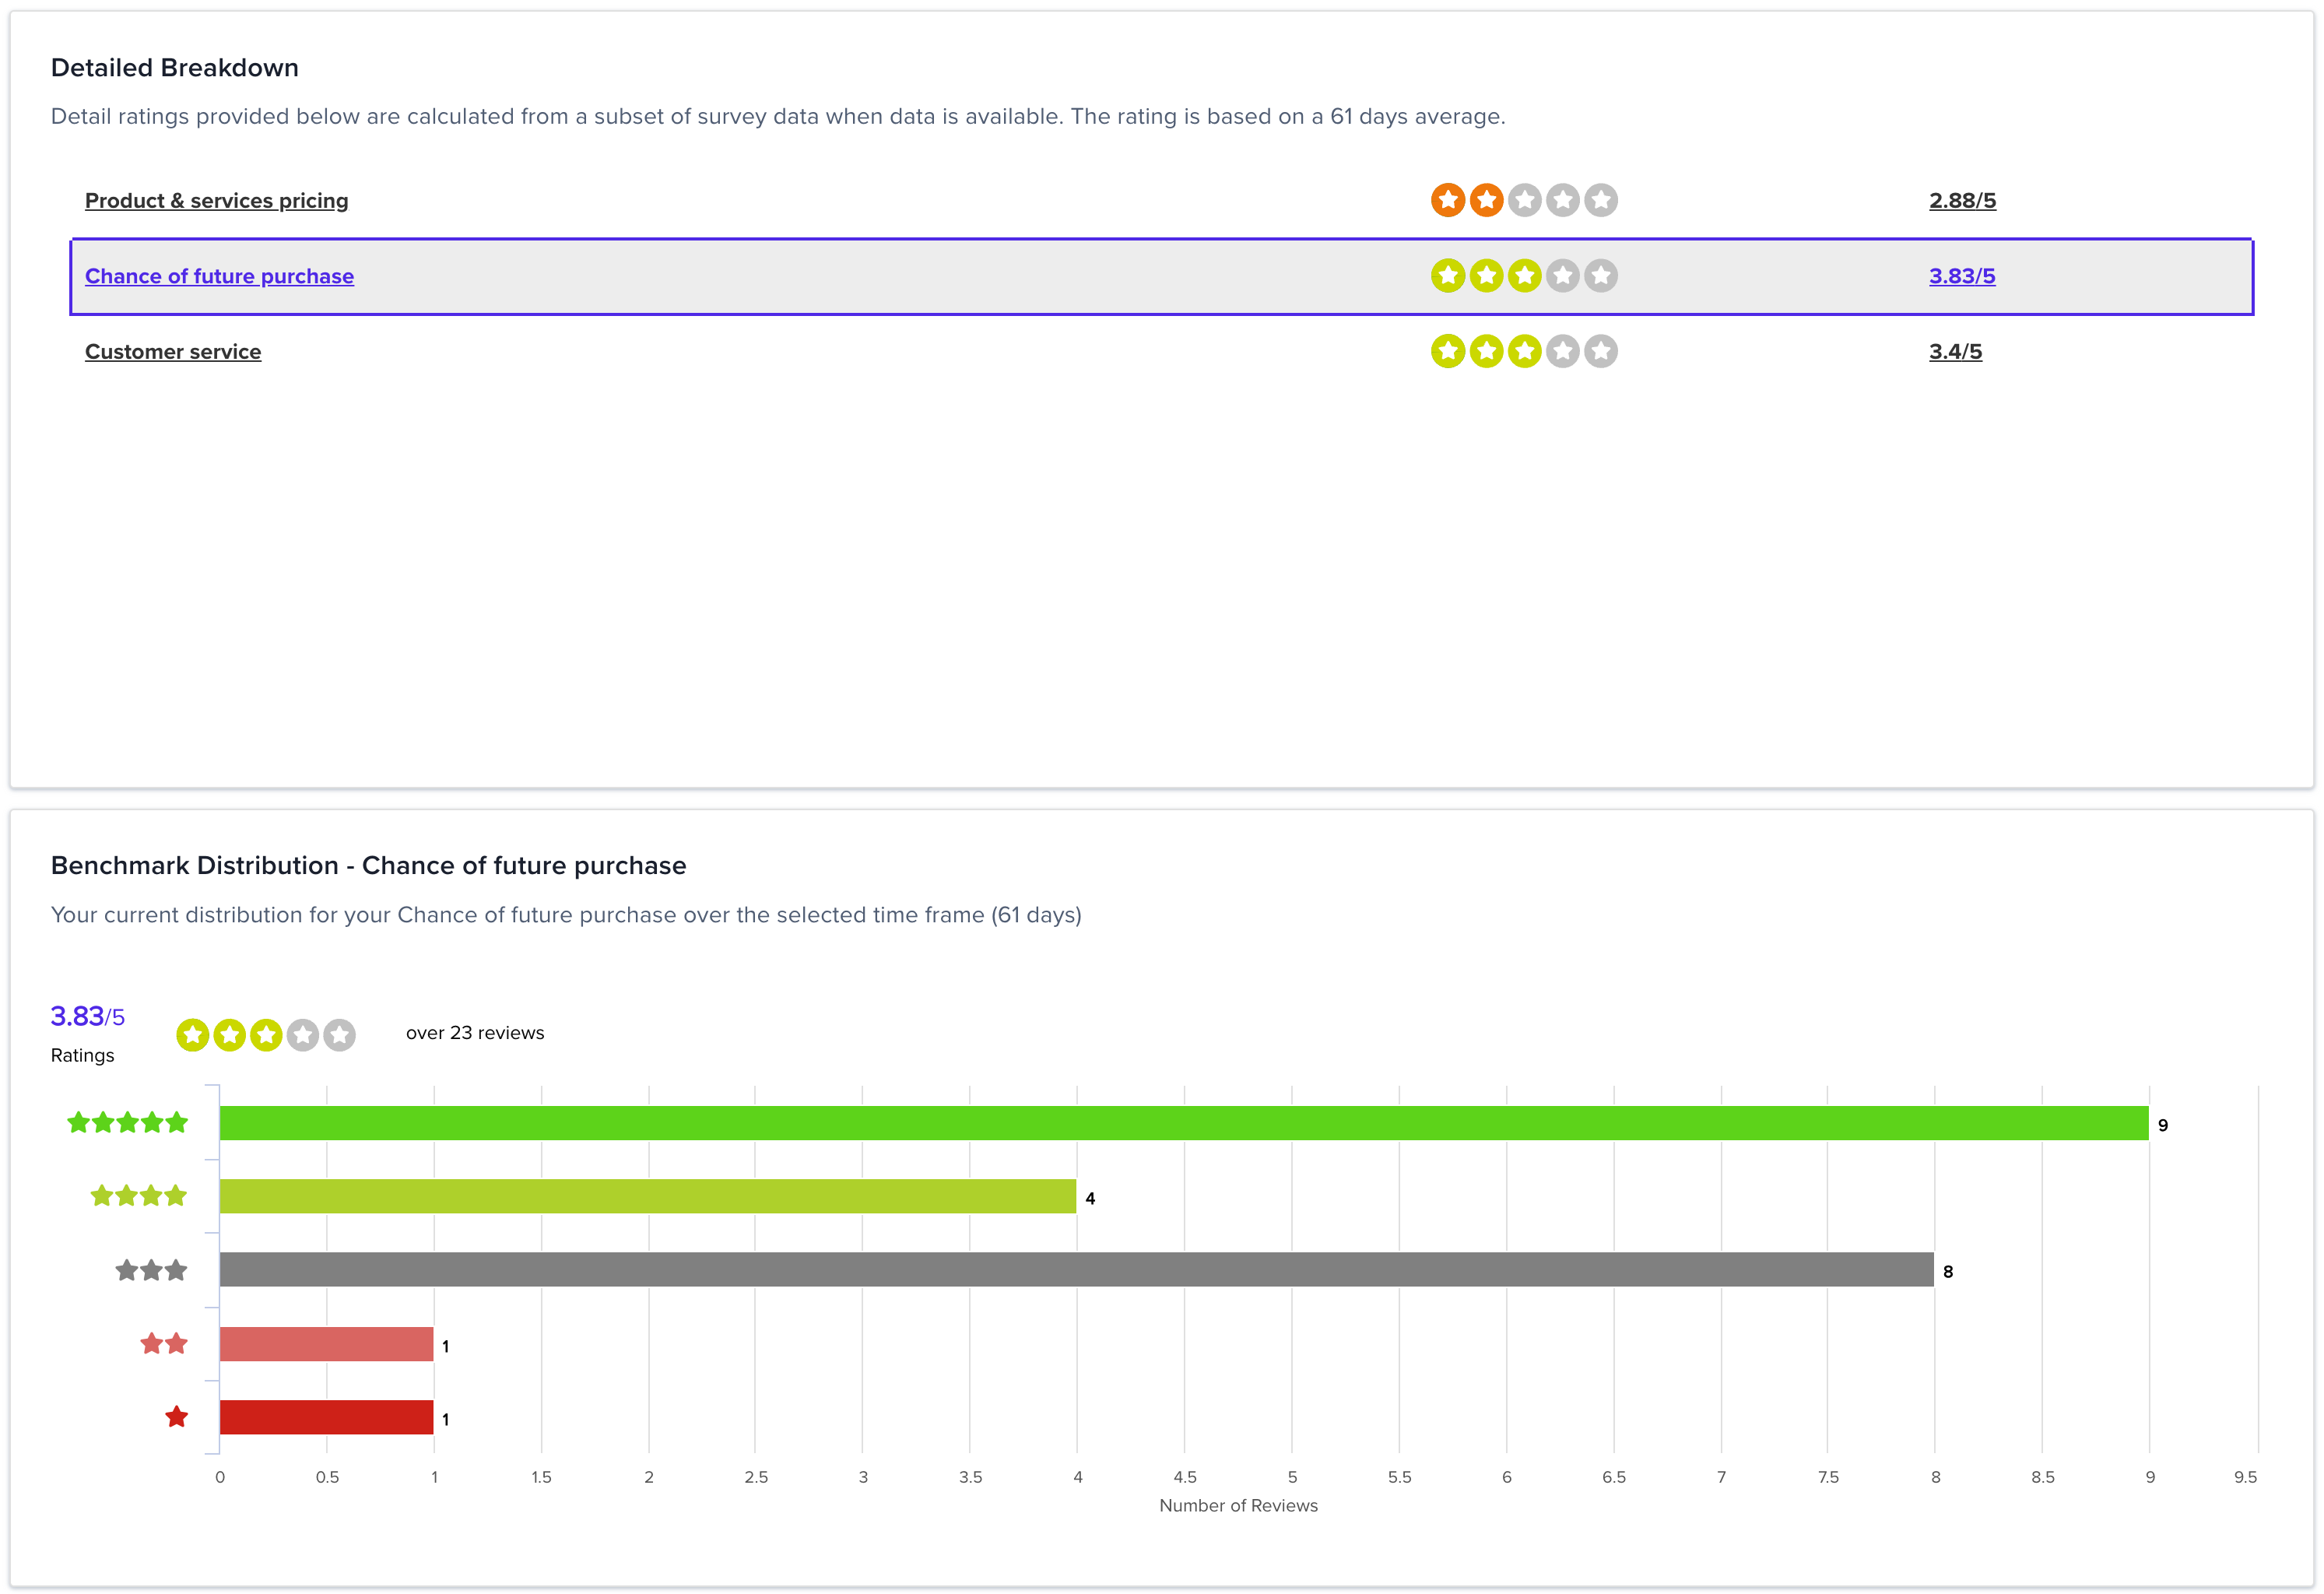
- Detail Breakdown of your brand metrics
- Product & services pricing
- Change of Future Purchase
- Customer Service
- Etc...
- The Current Rating distribution for all those Brand Metrics
- Manual Tags
Selecting a Brand Metric allows you to dive deeper, for example, selecting Chance of Future Purchase is generally a 3.85 out of 5. We can see and find the particular reviews that rated change of future purchase poorly.
Future more, we can click and select the particular set of reviews that led to that poor score rating.
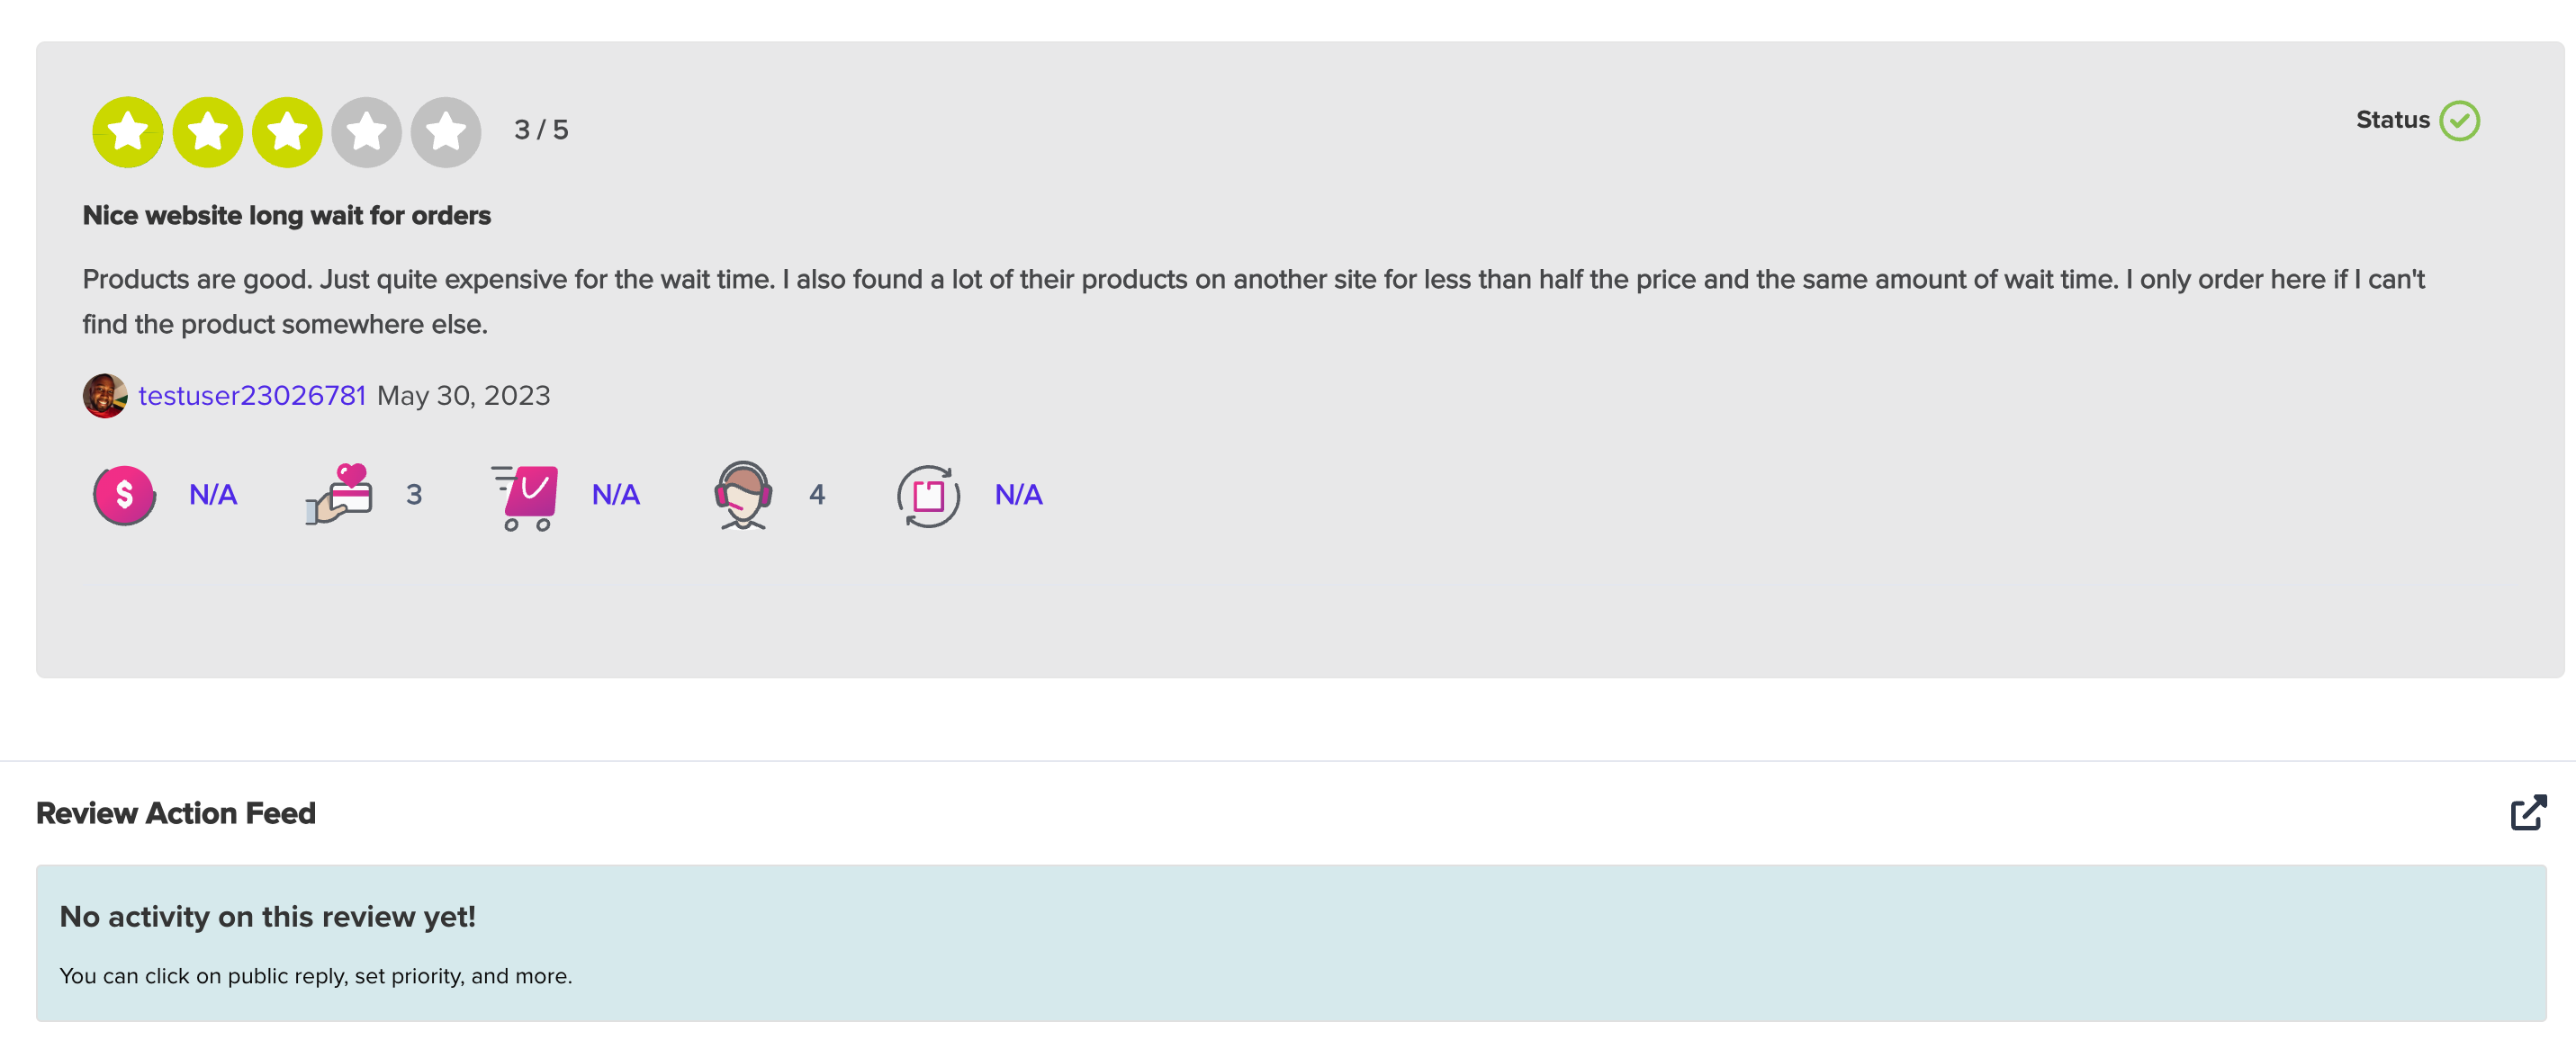
Your Merchant Metrics in your Engagement panel
When you click on a review in management, you can explore the specific metrics
Related Articles
Learn more about Brand Metrics here.